Figure 2.
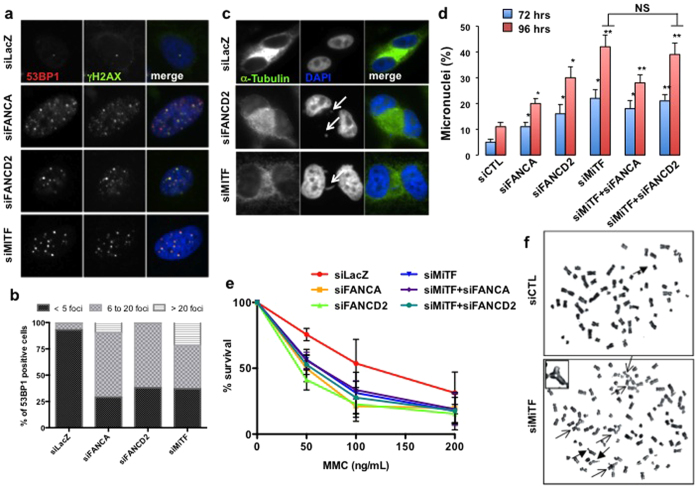
(a) Photomicrographs of 501 mel cells analysed 72 h after transfection with the indicated siRNA showing the level of 53BP1 (Red) and γH2AX (Green) subnuclear foci. DNA was stained via DAPI. (b) Histograms showing the percentage of 53BP1-positive cells classified as a function of the level of foci per cell. The data shown are from one representative experiment. (c) Photomicrographs of 501 mel cells captured 72 h after transfection with the indicated siRNA showing examples of analysed mitotic abnormalities, specifically micronuclei and anaphase bridges, indicated by arrows. Cells were treated with 10 ng/ml of MMC and 2 μg/ml of Cytochalasin B over-night before fixation. (d) Histograms showing the percentage of 501 mel cells presenting micronuclei at 72 or 96 h after transfection with the indicated siRNA. The data are the means of 3 independent experiments. The error bars indicate S.D. The statistical analysis was performed using Student’s T test. * indicates p < 0.05 and ** indicates p < 0.01. N.S., Not Significant. (e) Survival analysis in 501 mel cells exposed to increasing doses of mitomycin C. Each point represents the means of 3 independent experiments. The error bars indicate S.D. (f) 501 mel cells were transfected with control or MiTF-specific siRNA; 96 h later, these cells were exposed to mitomycin C (0.01 μg/ml) for 24 h. Metaphase spreads were analysed for chromosome breaks and radial figures. Representative images of radial figures and chromosome breaks are shown. The arrow indicates chromosomal aberrations. The inset is a magnification of a tri-radial chromosome.

