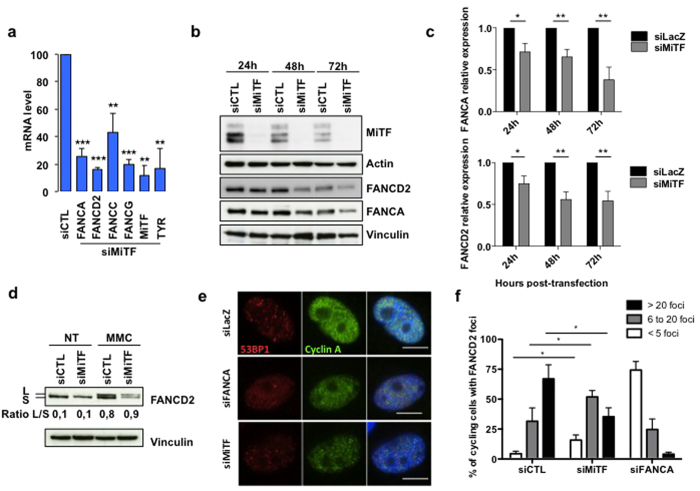
Figure 3.
(a) Histograms showing the relative level of the indicated mRNA 48 h after transfection with siRNA targeting MiTF expression in 501 mel. The specific MiTF target tyrosinase (Tyr) was used as a control for the loss-of-function of the transcription factor. The data are the means of 3 independent experiments. Statistical analysis was performed using Student’s T test, ** indicates p < 0.01 and *** indicates p < 0.001. (b) Immunoblot showing the time-dependent consequences of the siRNA-mediated downregulation of MiTF on FANCD2 and FANCA levels. MiTF expression also decreased spontaneously as a consequence of culture time; FANCA and FANCD2 decreased accordingly. Actin and Vinculin were used as loading controls. (c) Histograms showing the quantification of the relative FANCA (top) or FANCD2 (bottom) levels in siMiTF-depleted 501 mel cells. Data are the means of three independent experiments. The error bars indicate S.D. Statistical analysis was performed using Student’s T test, * indicates p < 0.05 and ** indicates p < 0.01. (d) Immunoblot showing DNA damage-induced FANCD2 monoubiquitination in 501 mel cells that were untreated (NT) or exposed to MMC (1 μg/ml 1 h) 48 h after transfection with the indicated siRNA. Vinculin was used as loading control. The L/S ratio was calculated using ImageJ software. (e) Photomicrographs showing examples of FANCD2 subnuclear foci (red) in S-G2 phases cells, i.e., positively stained with Cyclin A (green). DNA was stained with DAPI. The cells were treated with MMC (1 μg/ml 1 h) 72 h after transfection with the indicated siRNA. (f) Histograms showing the quantification of the data from experiments presented in (e). The data are the means of 3 independent experiments. The statistical analysis was performed using Student’s T test, * indicates p < 0.05.

