Figure 4.
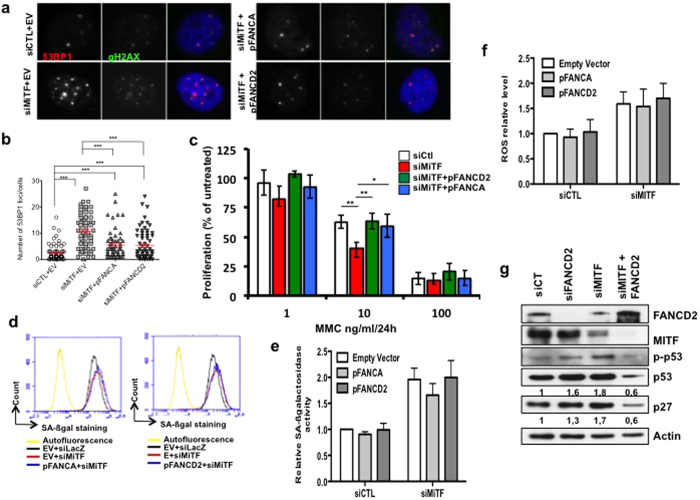
(a) Example of 501 mel cells transfected with the indicated siRNA and stained with anti-53BP1 (red) or γH2AX (green) to show the presence of subnuclear foci. DNA was stained with DAPI. (b) Quantification of the number of 53BP1 foci per nucleus. At least 75 cells from 10 different microscope fields were scored. Data are from one of three independent experiments with similar results. The statistical analysis was performed using Student’s T test, *** indicates p < 0.001. The mean and the S.E.M. are indicated in red. (c) Cell proliferation analysis of MITF-depleted or MITF-depleted and FANCD2 or FANCA overexpressing 501 mel melanoma cells exposed to increasing doses of mitomycin C. Each point represents the means of 3 independent experiments. Statistical analysis was performed using Student’s T test. * indicates p < 0.05 and ** indicates p < 0.01 in relation to siCTL or siMiTF-transfected cells. (d) SA-βGal relative activity evaluated via FACS analysis 72 h after transfection with the indicated plasmids and/or siRNA in 501 mel melanoma cells. (e) Relative SA-βGal activity in 501 mel cells 72 h after transfection with the indicated vectors and siRNA. The data are the means of at least 3 independent experiments. The error bars indicate S.D. (f) Relative intracellular ROS content in 501 mel cells 72 h after transfection with the indicated vectors and siRNA. The data are the means of at least 3 independent experiments. The error bars indicate S.D. (g) Immunoblot showing the effects of the transfection with the indicated vectors and siRNA in 501 mel melanoma cells on p53, P-p53, and p27 levels at 72 h post-transfection. Actin expression was used as a loading control.

