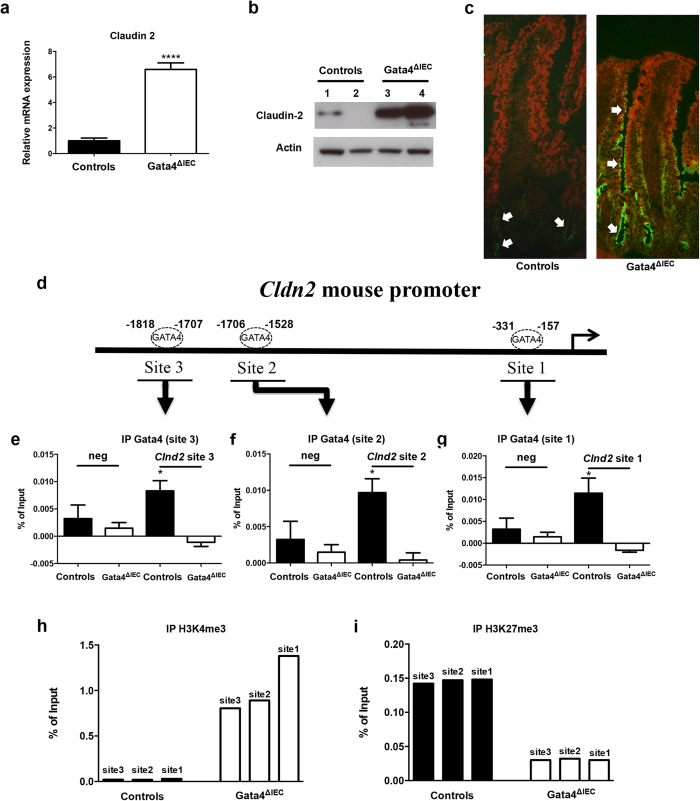
Figure 2. Claudin-2 expression is derepressed in the jejunum of Gata4 mutant mice.
(a) Total RNA was isolated from the jejunum of control and Gata4ΔIEC mice (n = 3–4 per group) and RT-qPCR was performed to quantify claudin-2 gene transcripts. ****P < 0.0001 (Student-t test). (b) Western blot analysis was performed using a claudin-2 polyclonal antibody on total lysates prepared from control and Gata4ΔIEC mice. An actin polyclonal antibody was used as a loading control to monitor protein integrity. Cropped blots are displayed and full-length blots are included in the supplementary information. (c) Immunofluorescence detection of claudin-2 on jejunum sections prepared from control and Gata4ΔIEC mice. Arrows display typical labeling in the tight junctions. Original magnification: 10X. (d) Schematic representation of the Cldn2 gene with its predicted binding sites for GATA. (e–g) ChIP analysis of three paired biological samples (n = 3) obtained from the jejunum of control and Gata4ΔIEC mice. Data were obtained by qPCR and are expressed as the percent of total DNA input used for precipitation with an antibody against Gata4 relative to the DNA precipitated with normal goat-IgG. *P < 0.05 (ANOVA test). (h,i) ChIP analysis from the jejunum of control and Gata4ΔIEC mice. Data were obtained by qPCR and are expressed as the percent of total DNA input used for precipitation with an antibody against H3K4me3 (h) or H3K27me3 (i) relative to the DNA precipitated with normal IgG.

