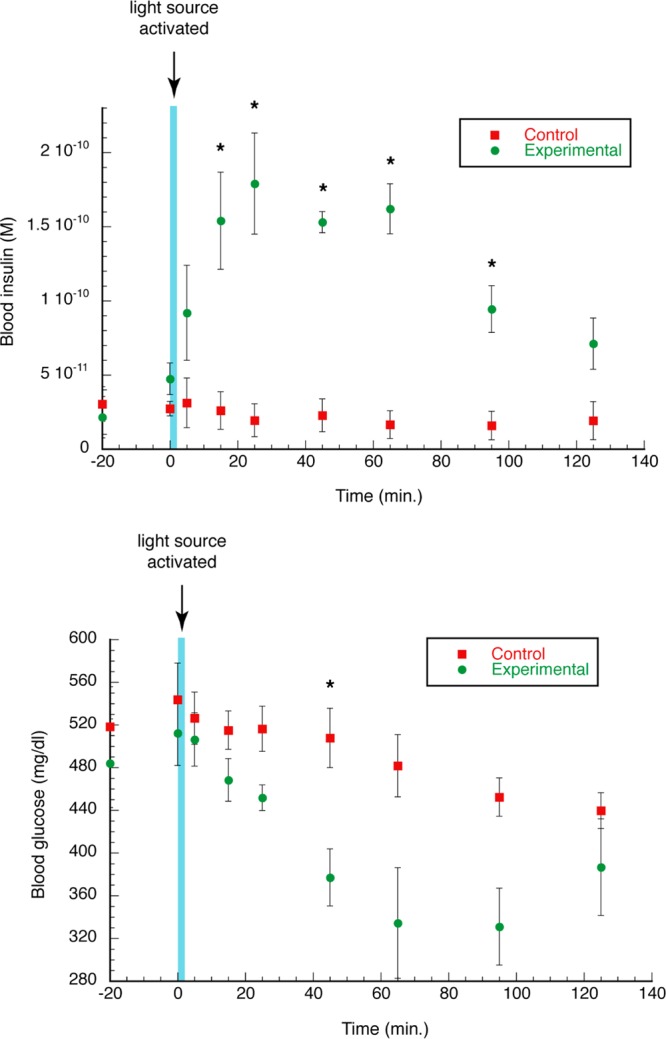
Figure 6.

Photoactivated insulin release. Blood insulin levels, as determined by ELISA assay (top panel), and blood glucose levels (bottom panel) before and after a 2 min period of LED activation (indicated by blue bar). * indicates p < 0.05 for differences between control and experimental points.
