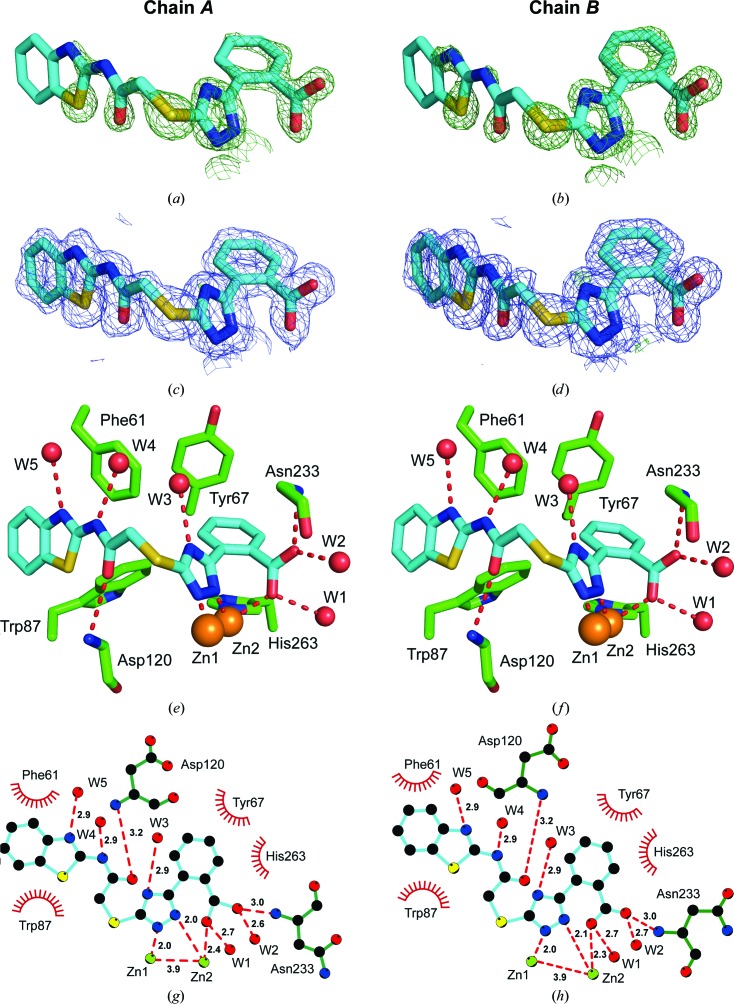
Figure 5.
OMIT maps (a, b), final density maps (c, d) and crystal structures (e, f) of compound 1 bound to the active site of VIM-2. The complex crystallized with two copies in the asymmetric unit (chains A and B). C atoms of compound 1 are depicted in blue and VIM-2 C atoms in green. Water molecules are shown in red and Zn2+ ions in orange. The OMIT F o − F c maps are shown in dark green at 2.25σ. The final 2F o − F c electron-density maps around the ligand are shown in blue at 1σ. The final F o − F c difference density maps around the ligand are shown at 4σ (light green) and −4σ (red). The interactions were analysed using LIGPLOT (g, h). Hydrogen bonds are shown as red dashed lines and interatomic distances are given in Å. Hydrophobic interactions are indicated by red arcs.

