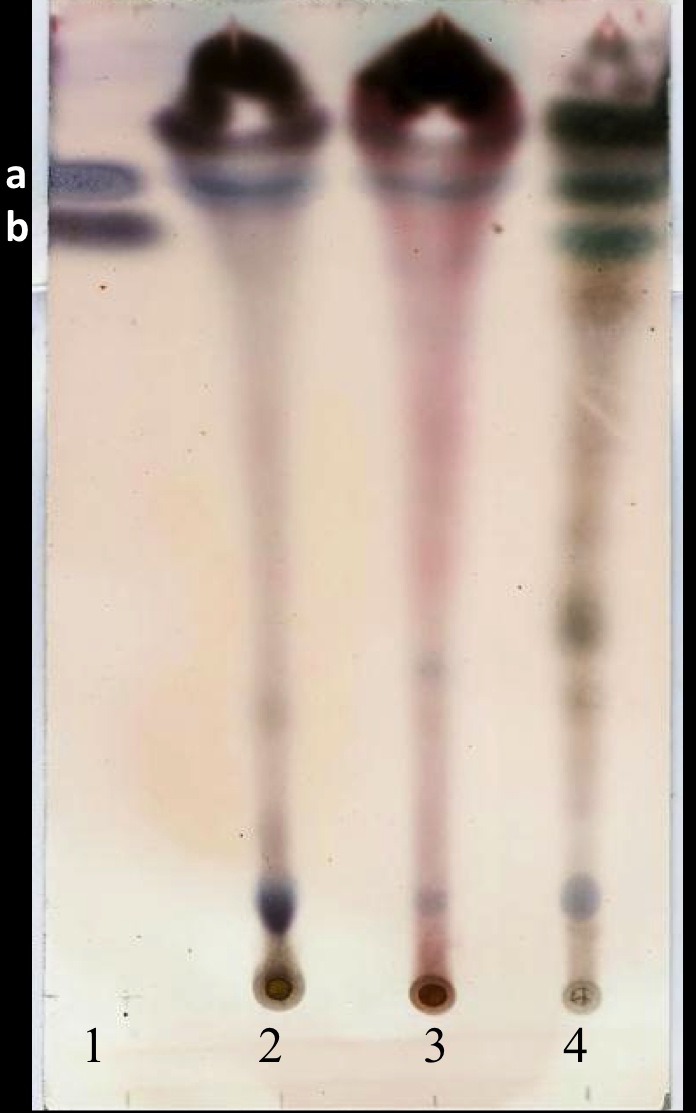
Figure 2. Thin layer chromatogram of crude hexane extracts from different tissues of Jatropha curcas MAP- 011107-G8.

Extracts were diluted to 0.1 g/mL and revealed with sulphuric anisaldehyde (Pertino et al., 2007). Lanes: (1) mixture of standards Jatrophone 10 mM + Jatropholone at 4 mM + b; (2) leaf extract; (3) bark extract; (4) root extract. In lane 1 band “a” represents the jatropholones (Rf = 0.817); and band “b,” the jatrophone (Rf = 0.772).
