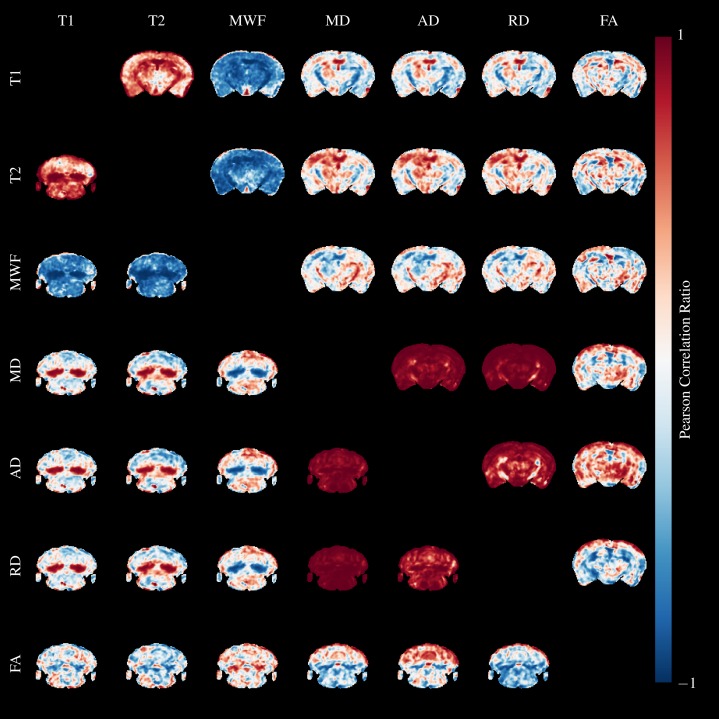
Figure 10. Pearson’s Correlation Ratio between each pair of MR parameters.
A slice through the external capsule is shown above the diagonal and a slice through the cerebellum below the diagonal. Correlations between parameters are very strong (but both positive and negative) in the arbor vitae and splenium.

