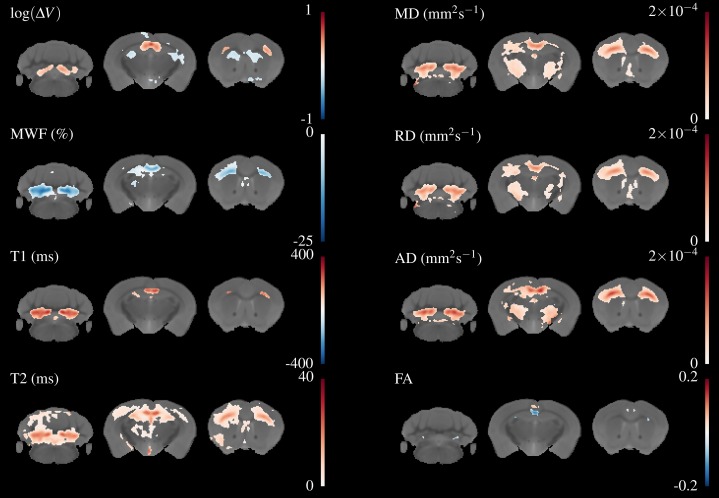
Figure 5. Differences in the group means of the volume change and quantitative parameters overlaid on the study template, thresholded at FWE-corrected p < 0.05.
The areas of significant change differ for each parameter, indicating different sensitivity and specificity to demyelination and inflammation.

