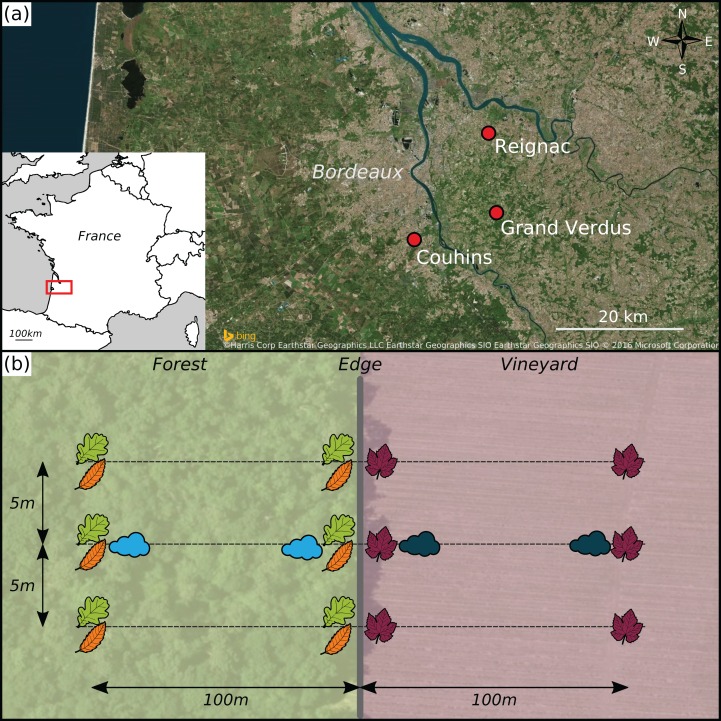
Figure 1. Experimental design.
(A) Geographical position of the three sampling sites, represented by red points. (B) Sampling design at each site. Leaf pictograms represent the sampling location of leaves in each site. Three leaves per plant species (i.e. grapevine in the vineyard and oak plus chestnut or hornbeam in the forest patch) were sampled at each location. Cloud pictograms represent the sampling location of airborne communities.

