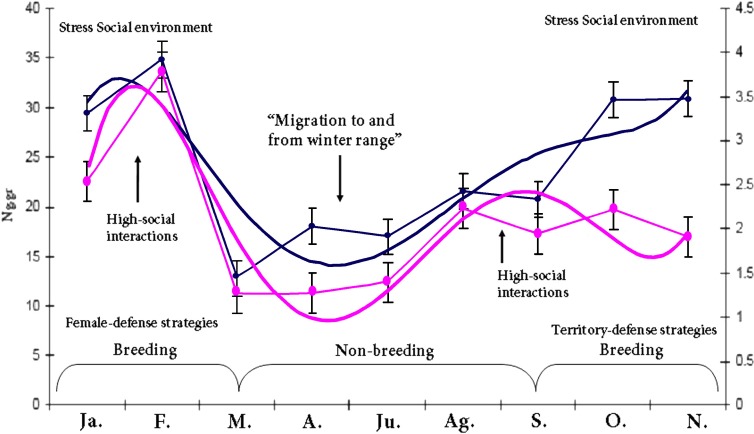
Figure 1. HPA & HPG axis activity patterns throughout the study period.
Blue line, the seasonal baseline fecal testosterone profile (defined by y = 0.0041x5 − 0.1102x4 + 1.0889x3 − 4.6819x2 + 7.914x − 0.7892; r2 = 0.7231), Pink line, the seasonal baseline fecal cortisol profile (defined by y = 0.0743x5 − 1.9677x4 + 19.136x3 − 82.442x2 + 147.4x − 58.902; r2 = 0.806). There was marked adrenal and gonadal activity during the breeding and non-breeding (CI = 7.661734–12.057391, mean = 25.75864/15.89907 respectively) season respectively for the male groups, the GCs and T response was due to seasonal variation in the guanacos highlighting the individual’s energetic demands according to life-history strategies.

