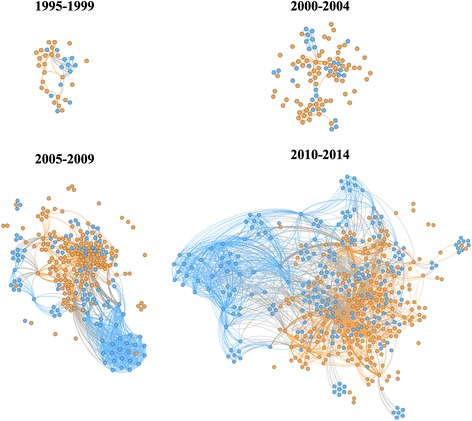
Fig. 2.

Evolution of the Brazilian collaborative networks on dengue research, 1995–2014. Organisation links were mapped based on the affiliations of the authors of scientific papers. Each node represents one organisation and two organisations were considered connected if their authors shared the authorship of a paper. The thickness of the links indicates the frequency of collaboration between two nodes. The node colour indicates whether the organisation is Brazilian (orange) or from abroad (blue)
