Fig. 1.

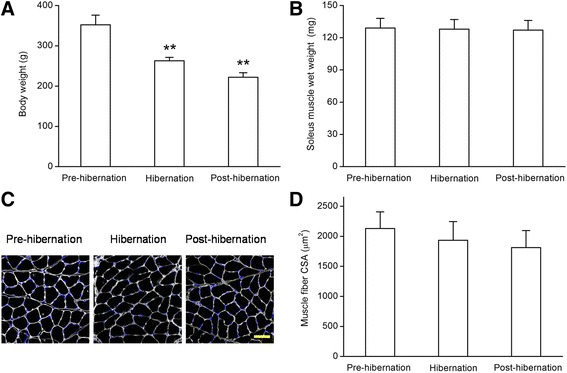
Body weight (a) and soleus muscle wet weight (b) of Daurian ground squirrels in pre-hibernation, 60-d and post-hibernation groups. Representative images (c) and bar graph (d) showing the changes in cross-sectional area of soleus muscle from 3 groups. White represents the anti-laminin stain of interstitial tissue counterstained with DAPI (blue) for nuclei identifcation. Scale bar = 50 μm. Values are means ± SEM, n = 6 in each group. **P < 0.01 versus pre-hibernation group
