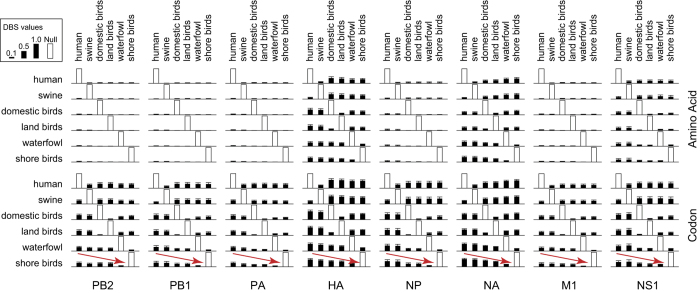
Figure 2. Mean DBS values of IAVs at the amino acid and codon levels.
Filled bars show the mean defined distances between each pair of species of each gene segment of the IAVs at the amino acid and codon levels, respectively. Standard deviations were plotted on top of each bar. A possible directional trend between species was depicted as arrows in the figure.

