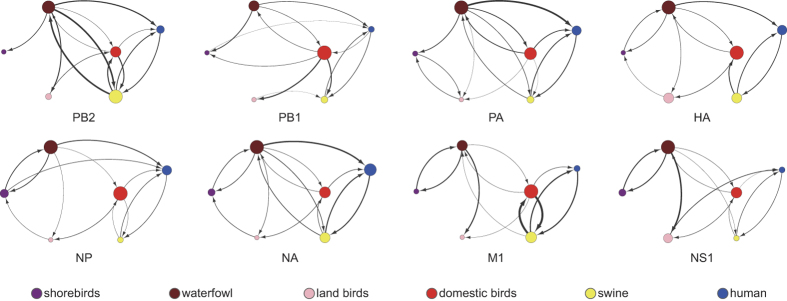
Figure 3. Cross-species transmission networks of IAVs.
The transmission linkage of species constructed using BEAST for each gene segment of IAVs. Each colored node represents a specific species. Lines and arrows represent transmissions and directions with Bayes factor >3. Thickness of lines represents the relative transmission rate between two species. The size of each node is proportional to the sum of the relative transmission rates of the species.

