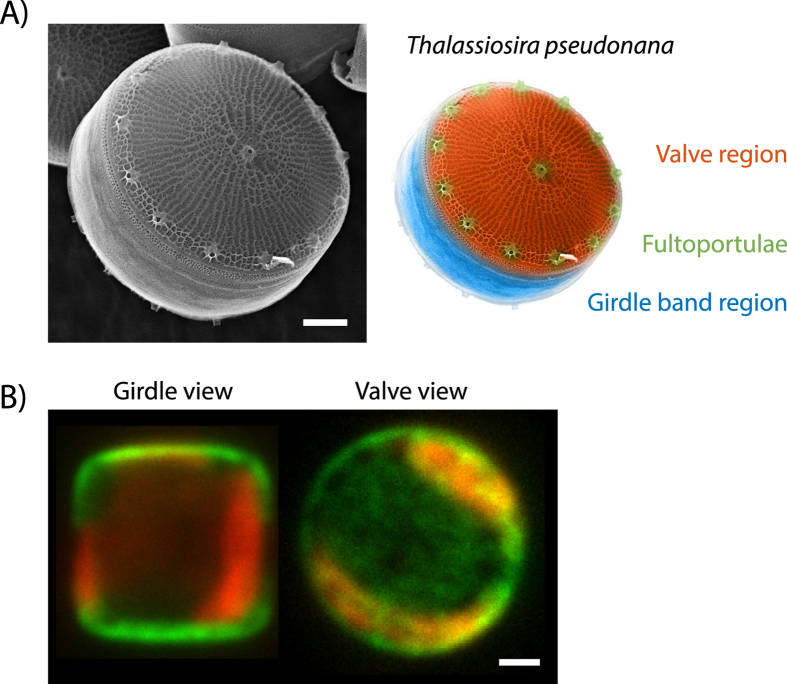
Figure 1. The diatom T. pseudonana.
(A) Left: SEM image of the T. pseudonana biosilica displaying parts of the girdle band region and the planar valve region featuring the prominent fultoportulae and a ridge network. Right: False coloring of the EM picture to highlight structural features of the T. pseudonana biosilica. (B) In vivo confocal microscopy images of two T. pseudonana cells with the GFP-tagged Sil3 protein in green (488 nm excitation) in ‘girdle view’ (left) and ‘valve view’ (right) orientation. The red fluorescence is caused by autofluorescence of the chloroplasts (647 nm excitation). All scale bars are 1 μm.

