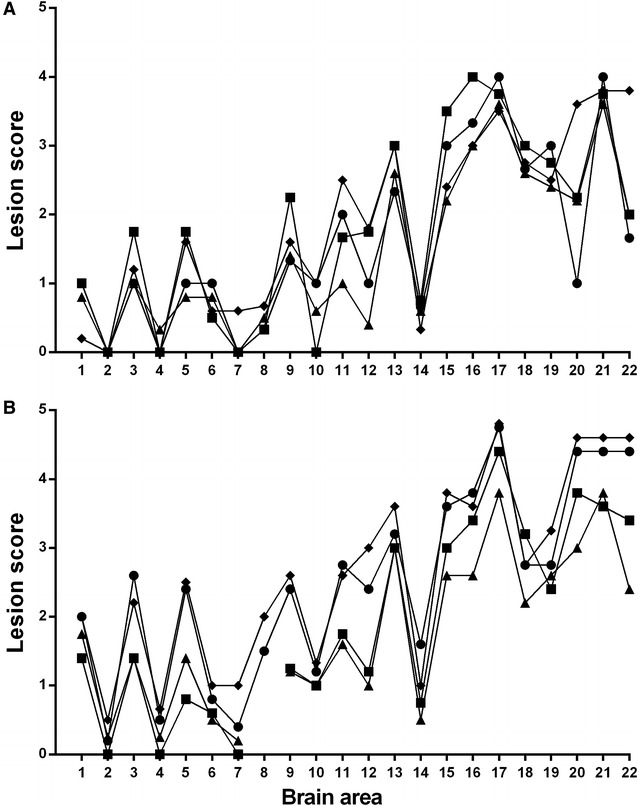
Figure 1.

Vacuolar lesion profiles. A Primary transmission of bovine L-BSE to sheep. Square = AFRQ/AFRQ recipients (n = 4), diamond = ARQ/ARQ recipients (n = 5), triangle = ARQ/VRQ recipients (n = 5), circle = VRQ/VRQ recipients (n = 3). B Subpassages of ovine L-BSE to sheep. Square = ARQ/VRQ recipient, ARQ/VRQ donor (n = 5), diamond = AFRQ/AFRQ recipient, AFRQ/AFRQ donor (n = 5), triangle = ARQ/VRQ recipient, AFRQ/AFRQ donor (n = 5), circle = AFRQ/AFRQ recipient, ARQ/VRQ donor (n = 5). X-axis: brain areas from Ligios et al. [31]. 1–11 brainstem areas, 12, 13 the cerebellum, 15–19 midbrain and thalamus, 20–22 the basal ganglia and frontal cortex. Y-axis: mean vacuolation score. Vacuolation is consistently greater in the more rostral brain areas than in the brainstem, regardless of genotype or passage history, with a slight but consistent increase in the intensity of vacuolation throughout the brain following sub-passage.
