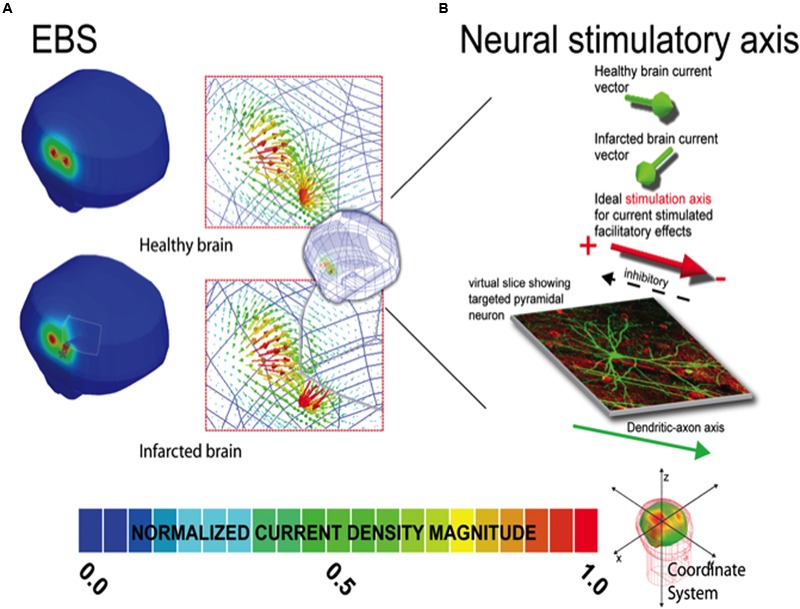
FIGURE 1.

Current density distribution maps induced by EBS stimulation. In (A), the left column depicts the current density magnitude for the corresponding healthy intact (top) and infarcted (bottom) brains stimulated with EBS. The borders and limits of the infarcted region are demarcated with a thin white line. Note that the scales in (A) are normalized to the maxima of the solution in each case (i.e., the maximum in the healthy brain is 1.19 A/m2 and 1.35 A/m2 in the infarcted brain). See location of the maxima in the infarcted (gray ◆) and healthy brains (gray ∗) indicating the location shift due to the infarction. Exact quantitative estimations on maxima shifts can be found in Table 2. In the right column of each panel, the vector distribution demonstrating the orientation of the currents is provided for both the intact and damaged brains. Note the direction of the currents can change substantially in the region of the perturbation. (B) Demonstrates how the distribution of EBS induced currents can be altered such that facilitatory stimulation might become inhibitory in select neural populations in the lesion region, when applying subthreshold polarizing currents where the stimulatory effect is dependent on the relative current density orientation to the axo-dendritic axis (Terzuolo and Bullock, 1956; Landau et al., 1964). In our results for select regions of tissue near the lesion border, the current orientation is altered relative to the neural axis such that the neural effect would be opposite of that predicted for the healthy brain. Note herein, the inhibitory/facilitatory axis is simplified for graphical representation, and will ultimately depend on the complexity and relative position of the neural structure, related to the axo-dendritic axis of the neuron. The total net effect across the total tissue stimulated could be comprised of a mix of areas receiving inhibitory and facilitatory stimulation (based on the relative neural cell and current density orientations in each individual patient relative to the stimulator source). Furthermore, such effects could potentially be seen in areas of in areas of complex sulcal anatomy even in healthy subjects. Unique solutions based on each individual patient’s stimulation criteria are thus recommended for individual patient dosing considerations.
