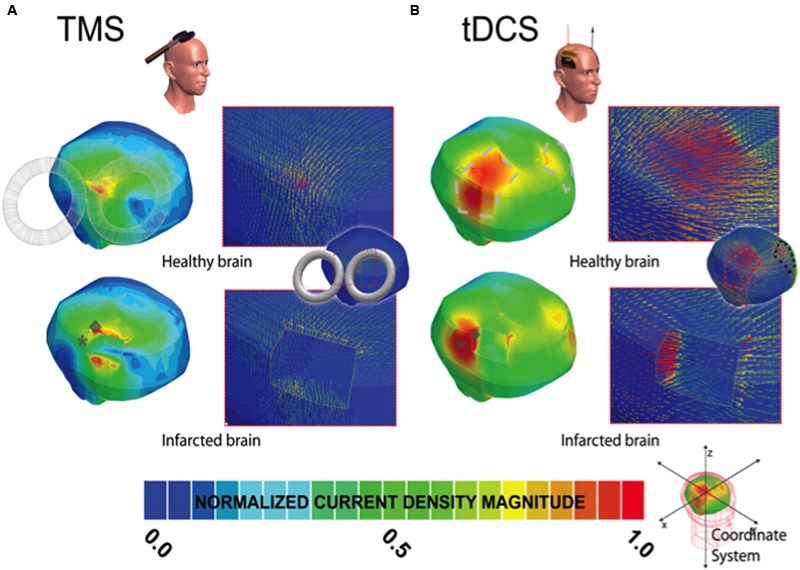
FIGURE 2.

Current density distribution maps induced by TMS and tDCS stimulation. In (A,B), the left column depicts the current density magnitude for the corresponding healthy or intact (top) and infarcted (bottom) brains stimulated with TMS and tDCS, respectively. The borders and limits of the infarcted region are demarcated with a thin white line. The modeled lesions presented for EBS (see Figure 1A), TMS (2A), and tDCS (2B) all have the same size and volume and occupy the exact same location in the right hemisphere in the infracted brain. As in Figure 1A, note that the scale of (A,B) is normalized to the maxima in the corresponding solution pictured (i.e., the maximum current density in the TMS healthy brain solution is 2.4 A/m2 and 4.16 in the infarcted brain, and 0.098 and 0.129 in the tDCS healthy and infarcted cases, respectively). The location of the maxima in the infarcted (gray ◆) and healthy brains (gray ∗) are both marked symbolically on the injured brain to indicate the estimated site shift (please zoom on the image for a better appreciation if needed). Note, as in EBS, the direction of the currents changes substantially in the region of the perturbation for both techniques.
