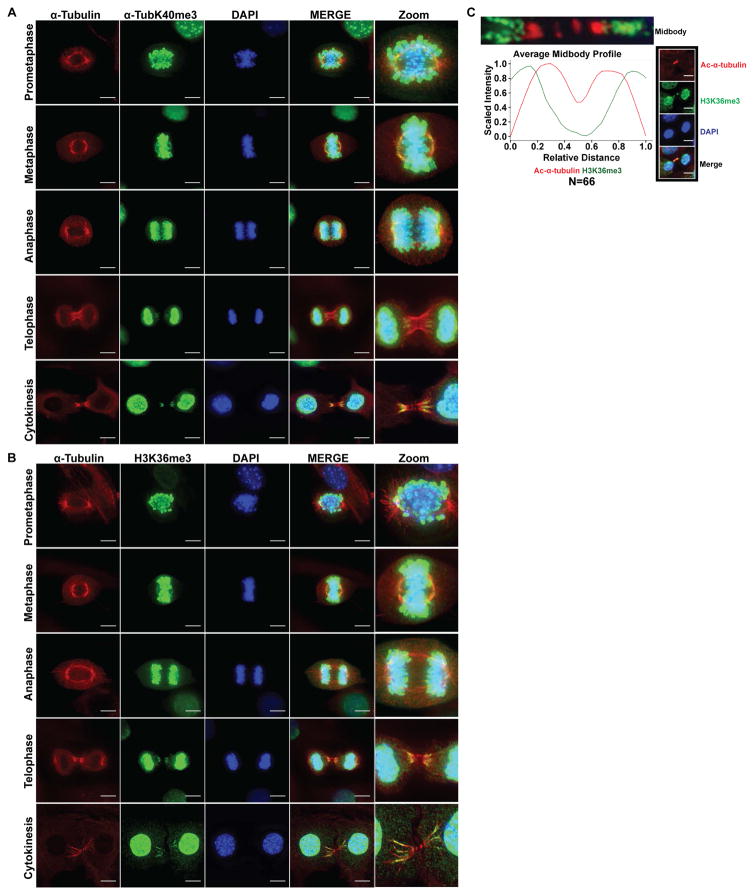
Figure 2. Microtubule methylation during mitosis and cytokinesis in MEFs.
(A) Representative images of cells stained using α-tubulin (red) and α-TubK40me3 (green) antibodies, counterstained with DAPI (blue). The far right panel (Zoom) indicates higher magnification images for better visualization. Scale bar =10μm.
(B) Representative images of cells stained using α-tubulin (red) and H3K36me3 (green) antibodies, counterstained with DAPI (blue). The far right panel (Zoom) indicates higher magnification images for better visualization. Scale bar =10μm.
(C) Quantitative analysis of average fluorescent intensities of midbodies immunostained with H3K36me3 (green curve) and acetylated α-tubulin (red curve) antibodies (N = 66 midbodies, from 3 independent experiments). Representative image showing H3K36me3 (green), acetylated α-tubulin (red) and DAPI (blue). Scale bar =10μm.
See also Figure S2 and S3.

