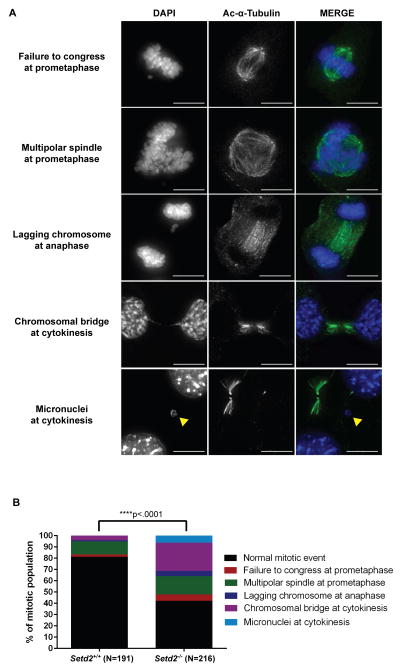
Figure 6. Mitotic and cytokinesis defects induced by loss of Setd2.
(A) Representative images of mitotic and cytokinesis defects in Setd2 KO MEFs using an acetylated α-tubulin (green) antibody and counterstained with DAPI (blue). Scale bar=10μm.
(B) Quantitation of abnormal mitotic events in Setd2+/+ control and Setd2−/− cells. N=number of dividing cells counted. ****p<0.0001.
See also Figure S6.

