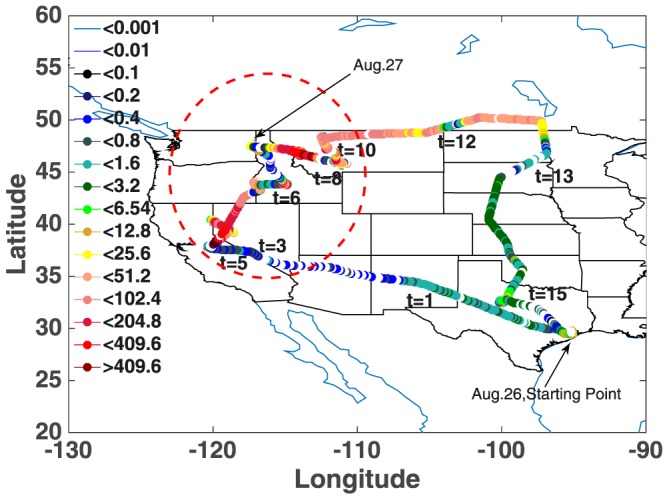
Figure 1.

Concentration of OA in standard air (unit: µg/std m3) along the flight tracks of the DC‐8 from 26 to 27 August. Study region is marked by red dashed circle. Starting points of flight of 26 and 27 August are denoted by the black text arrows.
