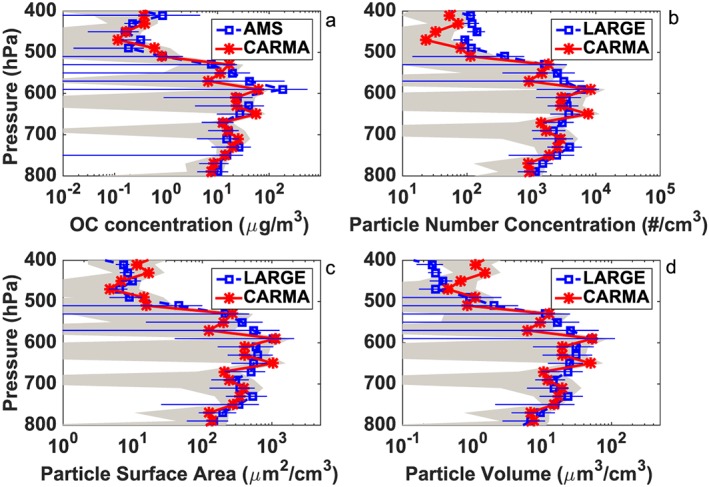
Figure 2.

(a) OA concentration, (b) particle number density, (c)aerosol surface area density, and (d) aerosol volume density of standard air simulated by CARMA (shown in solid red lines) and observed in SEAC4RS (show in dashed blue lines). The error bars denote variability (1 standard deviation) of observations. The grey shadings denote temporal and spatial variability of the model (1 standard deviation). Data are averaged from California to Montana along the flight track inside the dashed circle in Figure 1.
