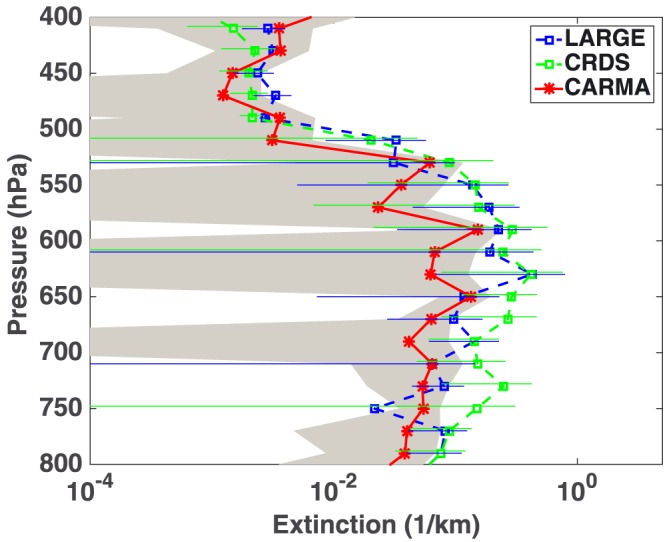
Figure 3.

Extinction coefficients at midvisible wavelength simulated by CARMA (red) and observed by LARGE (blue), CRDS (green). The error bars denote data variability (1 standard deviation) of observations. The grey shading denotes temporal and spatial variability of model (1 standard deviation).
