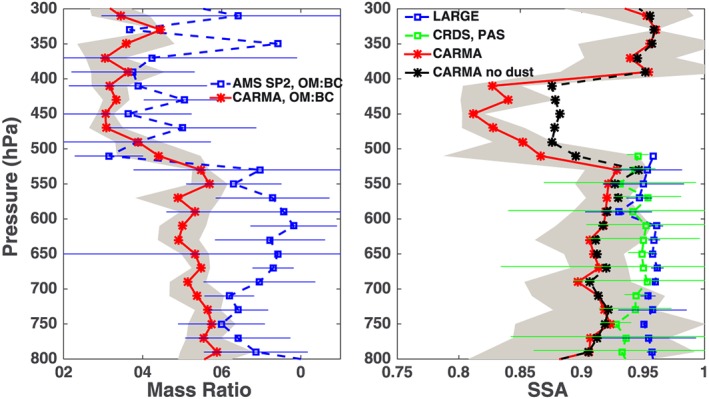
Figure 4.

(left) OA to BC mass ratio. CARMA simulations are shown in red, while observations are shown in blue dashed lines. The error bars denote variability (standard deviation) of observations; the grey shading denotes data variability of model. (right) Single scattering albedo (SSA) at midvisible wavelength simulated by CARMA (red) and observed by LARGE (blue). The green lines denote calculated SSA using CRDS for dry extinction coefficient and PAS for dry absorption coefficient. The black dashed lines denote modeled SSA in CARMA without dust aerosols.
