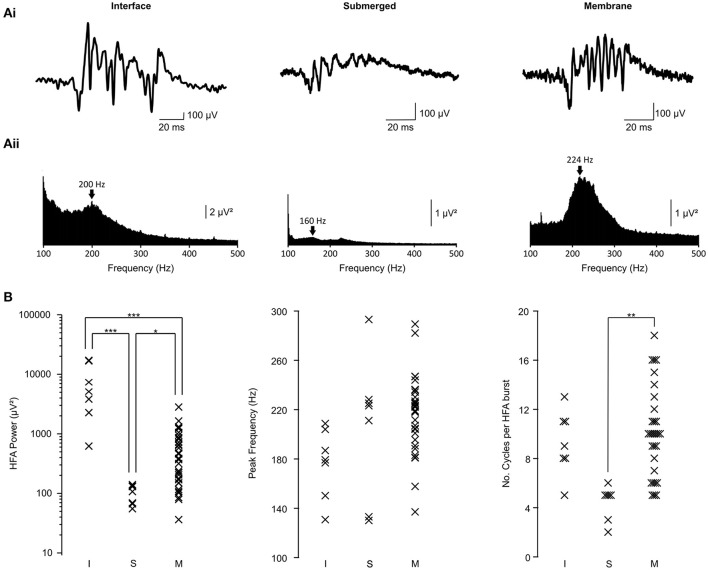
Figure 2.
HFA properties in interface, submerged and membrane chambers. (Ai) Raw traces showing a representative burst of high frequency activity in each chamber type. The submerged and membrane traces are presented on the same amplitude scale. All traces are presented on the same time scale. (Aii) Power spectra derived from the traces shown in (Ai). Arrows indicate the peak frequency within HFA band on each trace. Submerged and interface power spectra are presented on the same scale. (B) Population data showing all measured parameters for each slice. Data are separated into interface (I; n = 7 slices from 6 animals), submerged (S, n = 7 slices from 5 animals) and membrane (M, n = 33 slices from 24 animals). For power: ***p < 0.0005; * p < 0.025; ANOVA with Bonferroni post-hoc correction. For number of cycles: ** p < 0.005; Kruskal Wallis test.

