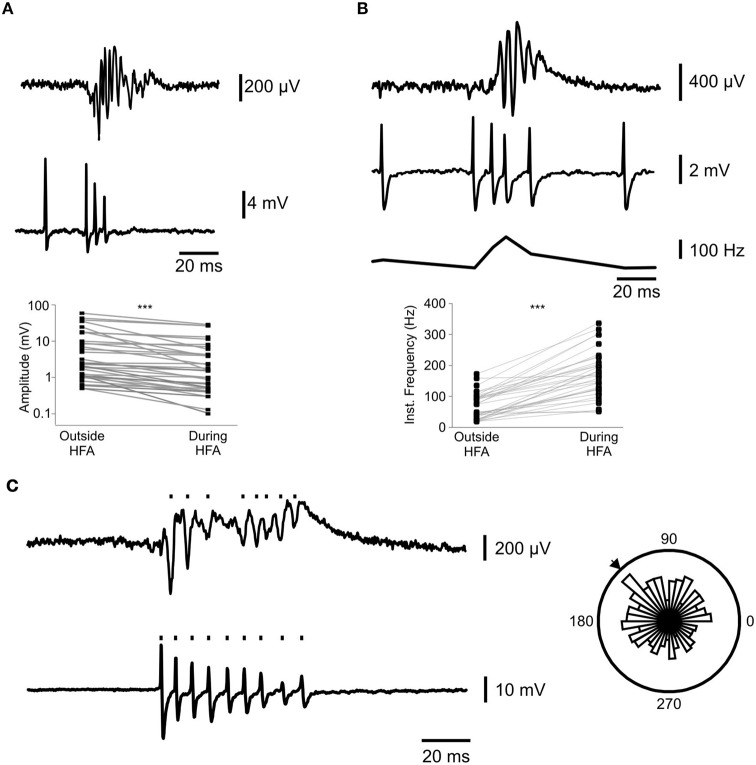
Figure 4.
Interneuron firing has high frequency and low amplitude during bursts and can participate in HFA. (A) shows a representative progressive decrease in action potential amplitude in (loose patch configuration (middle panel)) during the simultaneous burst in local field potential recordings (top panel). The scatterplot (bottom panel) shows the baseline action potential amplitude paired to the minimal amplitude during an epileptiform burst for 34 interneurons (***p = 3.6 × 10⁻⁷; Wilcoxon Signed Ranks test). (B) represents the increase in interneuron firing frequency (ii) during epileptiform bursts (i). Panel (iii) shows the instantaneous frequency of the action potentials in (ii). (iv) shows the paired increases in firing frequency during epileptiform bursts for 34 interneurons (***p = 3.6 × 10⁻⁷, Wilcoxon Signed Ranks test). (C) shows the detection of HFA (upper trace) and action potential (lower trace) events. Rose plot shows a significant (Rayleight test p < 0.05) relationship between the two. The arrow denotes the mean phase lag between the signals.

