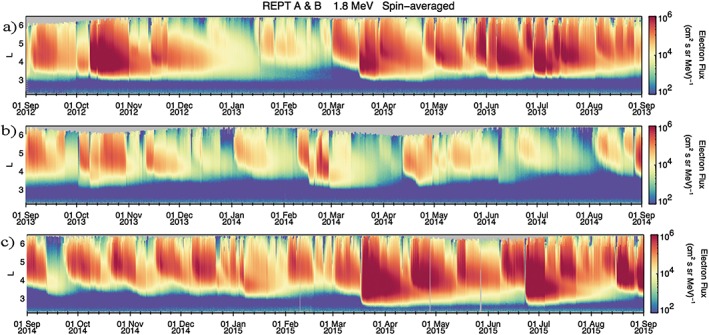
Figure 1.

Color‐coded electron intensities for electrons with E ~ 1.8 MeV, as described in the text for the period (a) September 2012 to August 2013; (b) September 2013 to August 2014; and (c) September 2014 to August 2015. Each panel shows fluxes in an L value versus time format.
