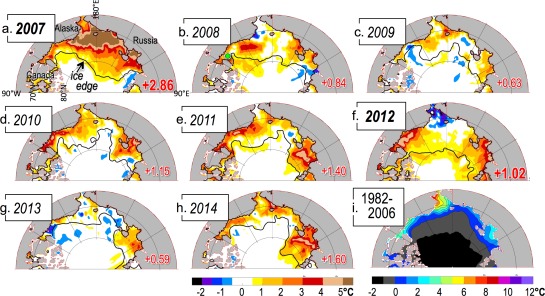
Figure 1.

(a–h) August–September sea surface temperature (SST) anomalies for the years 2007–2014 from OISST (see section 2) in the “Pacific Sector” of the Arctic Ocean, (i) relative to the August–September 1982–2006 mean. The September mean ice edge (from 25 km passive microwave data) is also shown (black contour). In each plot, the areal mean anomaly is shown in red, where the area is defined as north of Bering Strait and the coastlines up to the ice edge. The 2 years 2007 and 2012 with strongest historical ice retreat are highlighted in bold font. For the year 2008, a green dot in the eastern Beaufort Sea indicates the position of the time series presented in Figure 2.
