
Figure 10.
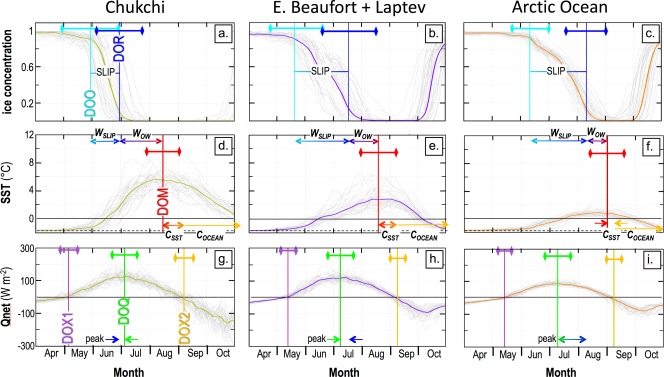
Seasonal time series over the years 1982–2014, averaged over three regions: the Chukchi Sea (left column), the Eastern Beaufort and Laptev Seas (middle column), and the rest of the domain, termed “Arctic Ocean” (right column). The Chukchi and Eastern Beaufort Sea areas are defined using the coastlines and the mean DOR = 1 August contour; the Laptev Sea is similar but has longitude limits 116°E to 155°E. Gray lines are regional median time series for each year; the thicker colored line in each panel provides the multiyear median. Also shown are the key dates defined in Figure 2 (vertical lines), ± one standard deviation of interannual variability in these dates (horizontal bars with diamond symbol end‐points), the two warming phases WSLIP and WOW, the two cooling phases CSST and COCEAN, and the time difference between the DOQ and the DOR, termed “peak” here.