
Figure 11.
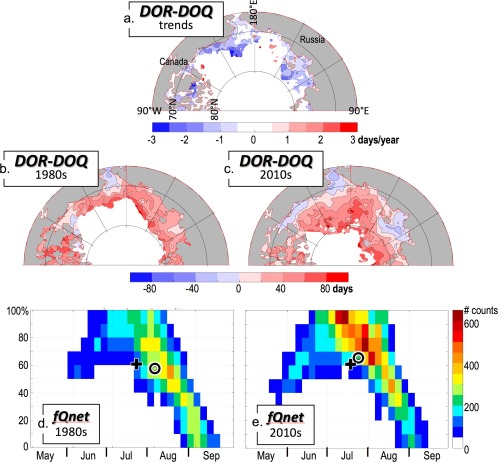
(a) Long‐term linear trends (95% or greater significance only) over 1982–2014 of the time difference DOR‐DOQ. Also shown are the mean DOR‐DOQ values averaged over (b) 1980–1989, and (c) 2010–2014. (d, e) The fraction fQnet (expressed as a percent) of Qnet at the time of ice retreat, relative to that at the Qnet maximum, for all points in the domain, i.e., fQnet = Qnet(DOR)/Qnet(DOQ) for the 1980s and the 2010s. The circle represents the centroid of all pixels, while the plus symbol provides a reference at a fixed location in both plots, i.e., (20 July, 60%).