Figure 12.

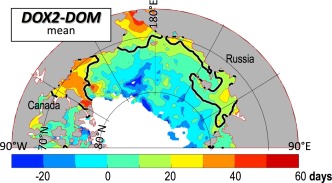
The quantity DOX2‐DOM, i.e., the time period between the date of maximum seasonal SST (i.e., the DOM) and the date when Qnet turns from downward heating to upward cooling (i.e., DOX2). Also shown is the mean DOR = 1 August black contour.

The quantity DOX2‐DOM, i.e., the time period between the date of maximum seasonal SST (i.e., the DOM) and the date when Qnet turns from downward heating to upward cooling (i.e., DOX2). Also shown is the mean DOR = 1 August black contour.