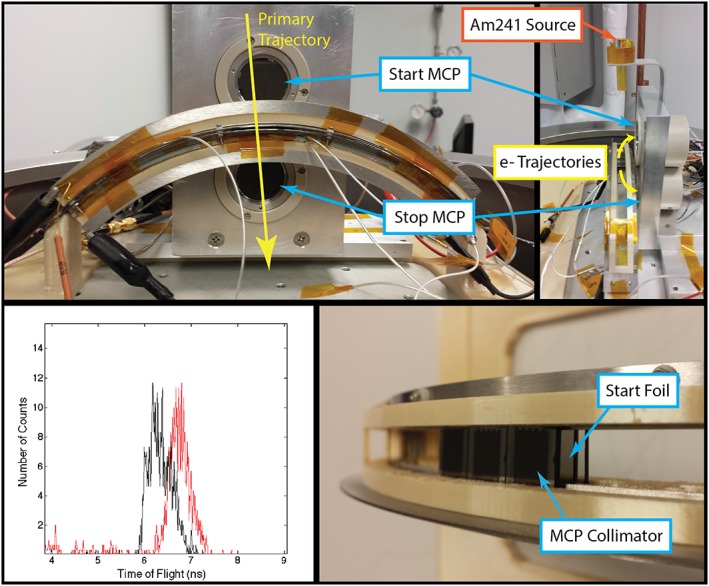
Figure 7.

The APL LENI breadboard test setup. The curved LENI collimator is populated by 3 pixels and ultrathin carbon foils. The top left figure shows the test setup with the timing start and stop MCPs. The top right figure shows the predicted electron trajectories. The bottom left figure shows the measured coincidence time between the start and stop MCP when tested using Am241 alphas through the system (5.486 MeV) with the black curve showing with the source is pointed down and the red curve with the source on the opposite side of the TOF assembly pointed up through the instrument. The bottom right figure shows a close‐up of the MCP collimator and foil.
