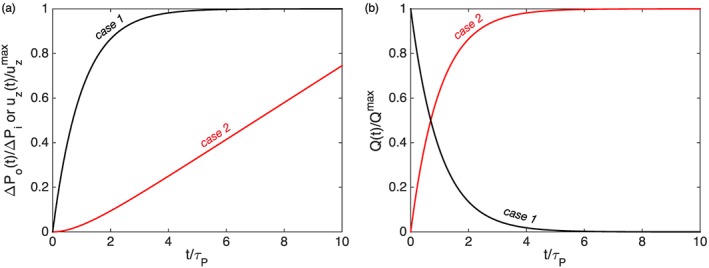
Figure 2.

Temporal evolution of (a) the pressure ΔP o(t) at the outlet of the conduit and the maximum vertical surface displacement u z(t), and (b) the volumetric flow rate Q(t) following the application of a constant inlet source pressure ΔP i (black line, case 1), and a linearly increasing inlet source pressure ΔP i(t) (red line, case 2). These dimensionless plots show time t scaled by the characteristic timescale τ P. The reservoir overpressure ΔP o(t) is scaled by the maximum inlet pressure ΔP i. The uplift u z(t) and volumetric flow rate Q(t) are scaled by their respective maximum values, and Q (max).
