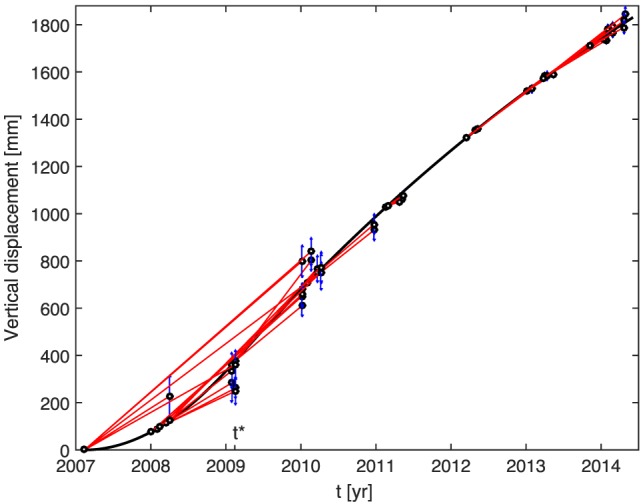
Figure 5.

Modeled time series (black curve) of cumulative vertical displacement for a point located at GPS station MAU2 (magenta asterisk on Figure 4) from 2007 to 2014, as derived from InSAR data and assuming a model of magma injection starting in 2007 in an elastic domain. InSAR displacement data set same as presented in Le Mével et al. [2015]. Each red line represents an individual InSAR pair connecting two SAR epochs (black circles). In each InSAR pair, the value of displacement is plotted to fall on the model curve and the value of relative displacement at the second epoch is plotted with its 68% confidence interval (vertical blue bars). The corresponding pressure and volumetric flow rate history are shown in Figure 10.
