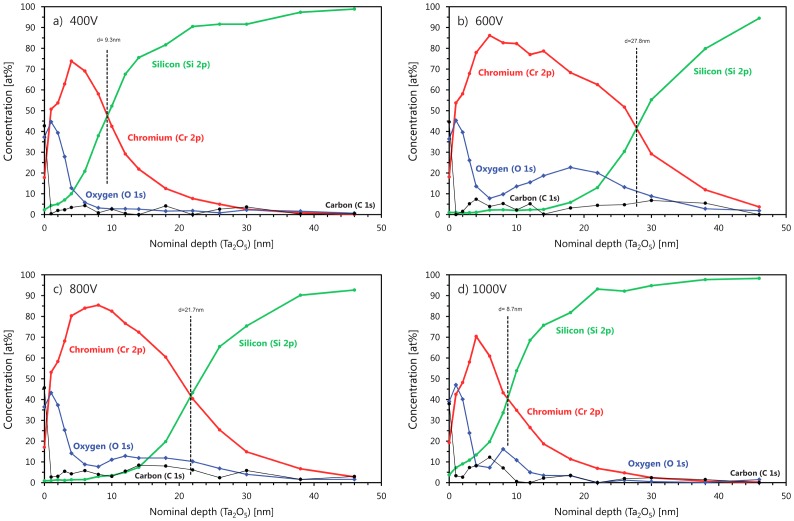
Figure 8.
XPS measurements on the F-MIE samples. From panel (a) to (d): 400, 600, 800, and 1000 V bias. The depth is not calibrated. The amount of oxygen in the outliers 600 and 800 V is considerably higher than the other two: this supports the idea of formation of oxides against the one on silicides. See text for discussion.

