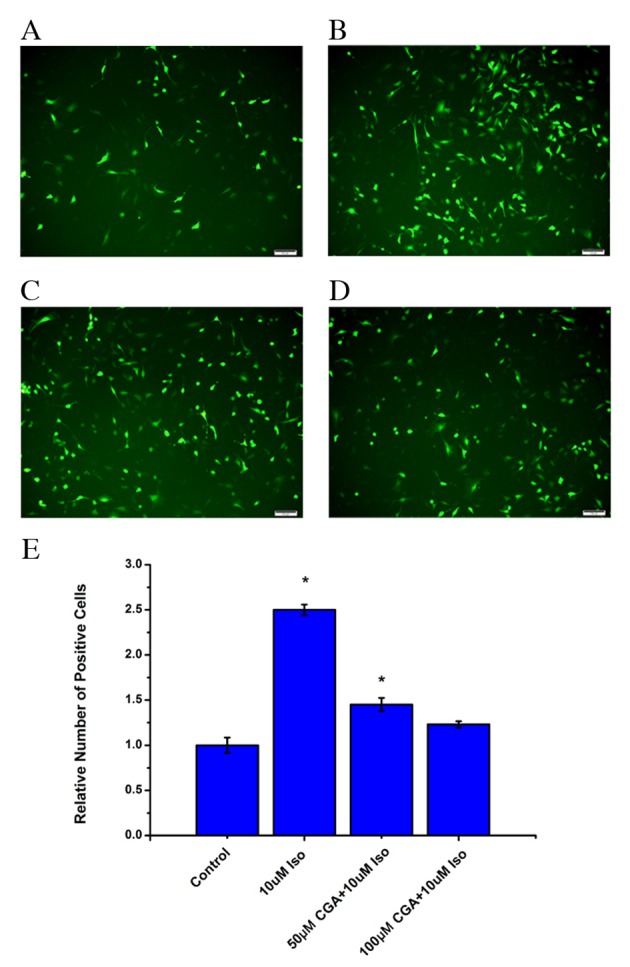
Figure 4.

Levels of ROS in vascular smooth muscle cells following treatment with Iso, in the absence or presence of CGA pretreatment, as measured using a fluorescent probe, 2′,7′-dichloro-dihydro-fluorescein diacetate. ROS levels were measured in (A) control cells, (B) 10 µM Iso-treated cells, (C) 50 µM CGA-and 10 µM Iso-treated cells, and (D) 100 µM CGA- and 10 µM Iso-treated cells. (E) Quantification ROS levels. Scale bars=100 µM. *P<0.05 vs. control. ROS, reactive oxygen species; Iso, isoproterenol; CGA, chlorogenic acid.
