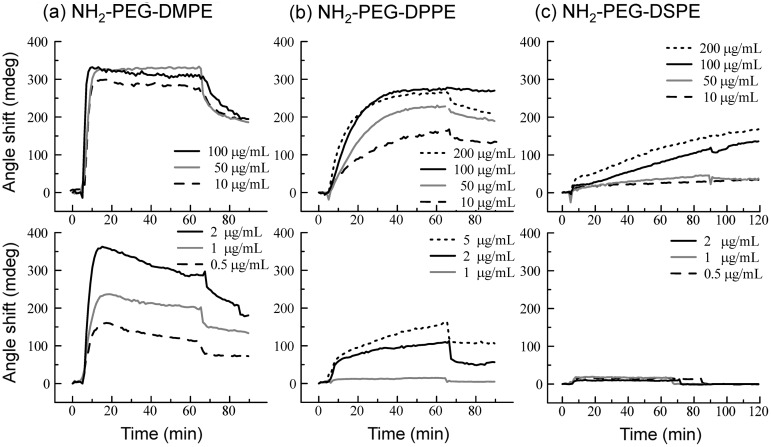
Figure 3.
SPR sensorgrams when NH2-PEG-lipids ((a) NH2-PEG-DMPE, (b) NH2-PEG-DPPE, (c) NH2-PEG-DSPE) were applied onto the supported lipid membrane. The SPR sensorgrams at concentrations of NH2-PEG-lipids above 10 μg ml–1 are shown in the upper panels while those at concentrations below 5 μg ml–1 PEG-lipids are shown in the lower panels.

