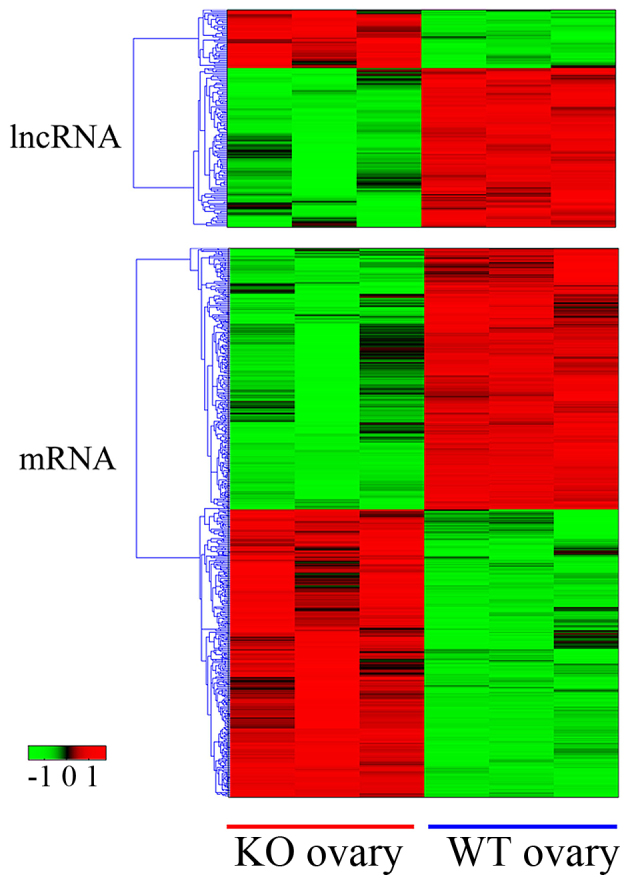
Figure 1.

Cluster analysis of differentially expressed lncRNAs and mRNAs in ovary tissues from WT and β-crystallin B2 knockout mice. The horizontal axis represents the sample group and the vertical axis represents the differentially expressed mRNAs or lncRNAs. Upregulated genes are red and downregulated genes are green. Included are 157 lncRNAs (42 downregulated vs. 115 upregulated) and 1,085 mRNAs (570 downregulated vs. 515 upregulated) KO, knockout; WT, wild-type; lncRNA, long non-coding RNA.
