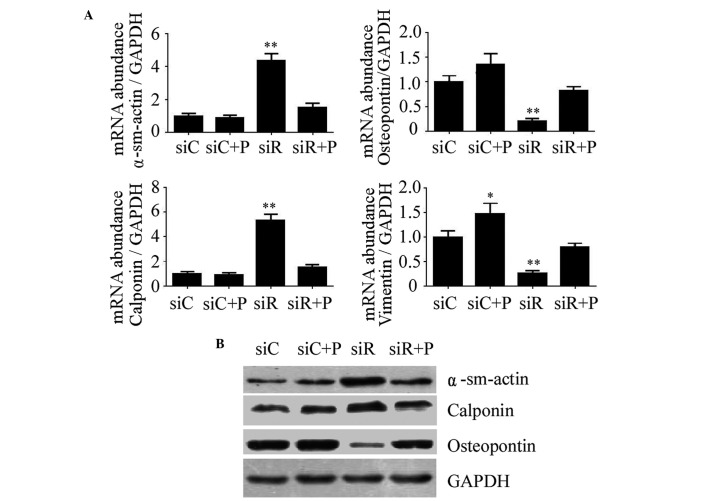
Figure 2.
Expression of molecular markers of the VSMC phenotype following various treatments. (A) The mRNA expression levels of α-sm-actin, Calponin, Osteopontin and Vimentin were determined by reverse transcription-quantitative polymerase chain reaction in T/G HA-VSMCs treated with siC, siR, siC + P, and siR + P. The mRNA expression levels were normalized against that of GAPDH. The data are presented as the mean ± standard deviation (*P<0.05 and **P<0.01 compared with the siC group.) (B) The protein expression levels of α-sm-actin, Calponin and Osteopontin were determined by western blotting analysis. The protein and mRNA expression changes were confirmed to be the same. GAPDH was used as a loading control. si, siRNA; C, control; R, Rab5a; P, PDGF; PDGF, platelet-derived growth factor; T/G HA-VSMC, human aorta-vascular smooth muscle cell line; α-sm-actin, α-smooth muscle actin.

