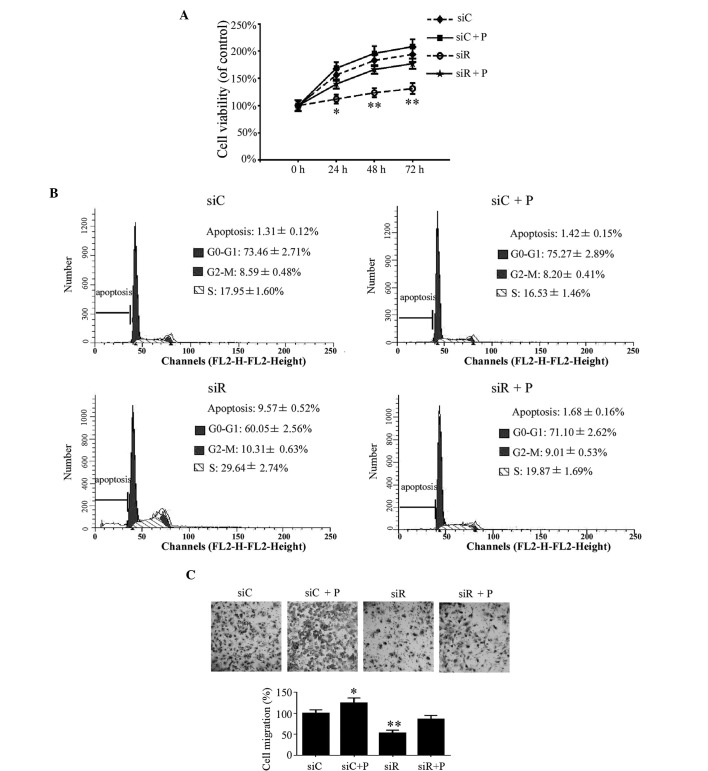
Figure 3.
Proliferation, cell cycle and migration in T/G HA-VSMCs following various treatments. (A) A sulforhodamine B assay was used to demonstrate the growth of the cells following treatment that compared with siC, siR, siC + P and siR + P at 24, 48, and 72 h,. (B) Cell cycle analysis was performed by flow cytometry following treatment with siC, siR, siC + P and siR + P. The percentage of apoptotic, G0-G1, G2-M or S phase cells were calculated. (C) Microscopy observation (magnification, ×20) of the cells was performed following migration assay. The percentage of cells migrating was calculated. Quantified data are presented as the mean ± standard deviation (**P<0.01 and *P<0.05 compared with the siC group.) si, siRNA; C, control; R, Rab5a; P, PDGF; PDGF, platelet-derived growth factor; T/G HA-VSMC, human aorta-vascular smooth muscle cell line.

