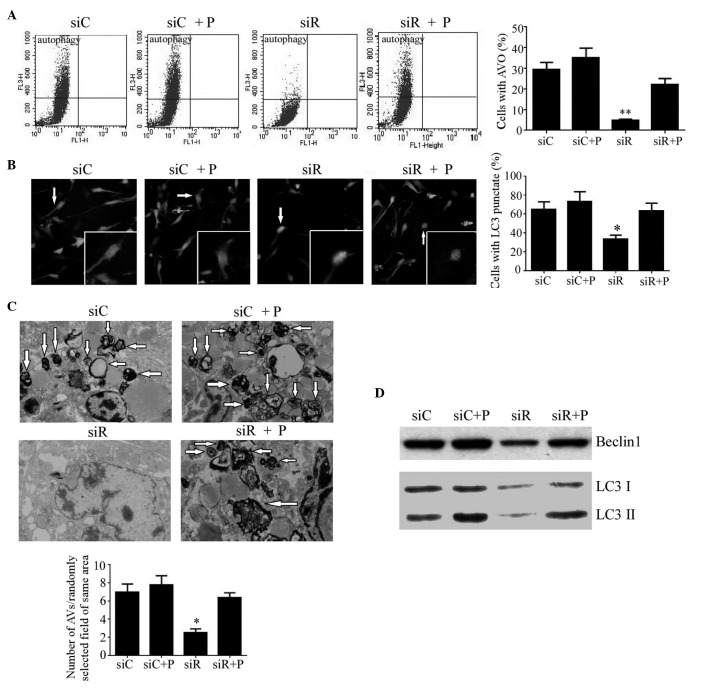
Figure 5.
Autophagy in T/G HA-VSMCs following various treatments. (A) Flow cytometry was performed to determine the percentage of cells with AVOs as a sign of autophagy following treatment with siC, siR, siC + P and siR + P. (B) Representative microscopy images (magnification, ×40) of fluorescence localization of LC3 were captured and the percentage of cells with punctate fluorescence was calculated. (C) Transmission electron microscopy (magnification, 1,000x) was performed to determine the number of autophagosomes with typical scattered double-membrane vacuolar structures (arrows). (D) The protein expression levels of Beclin1, LC3 I and LC3 II were determined by western blotting analysis. Quantified data are presented as the mean ± standard deviation (**P<0.01 and *P<0.05 compared with the siC group.) AVOs, acidic vesicular organelles; LC3, light chain 3; si, siRNA; C, control; R, Rab5a; P, PDGF; PDGF, platelet-derived growth factor; T/G HA-VSMC, human aorta-vascular smooth muscle cell line.

