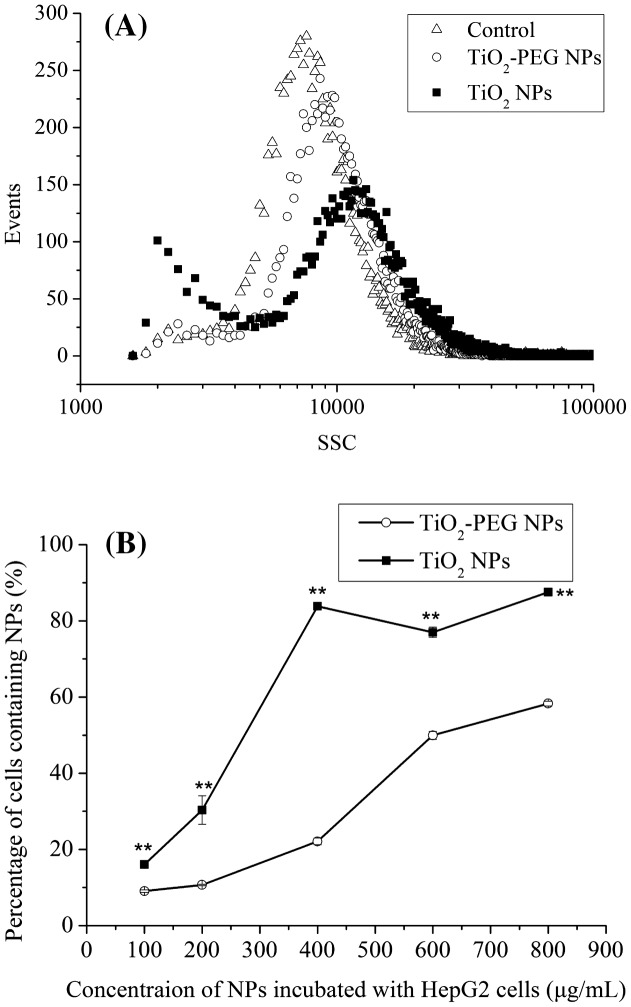
Figure 4.
Cellular uptake of TiO2 NPs and TiO2-PEG NPs. (A) Uptake rate of NPs by HepG2 cells. Cells were incubated without (open triangles) or with (closed squares) TiO2 and (open circles) TiO2-PEG NPs at a concentration of 100 μg ml–1 for 24 h. (B) Percentage of HepG2 cells containing NPs. Cells were incubated with TiO2 (closed squares) and TiO2-PEG NPs (open circles) at 0, 100, 200, 400, and 800 μg ml–1 for 24 h. All values are presented as mean ± SD (n ≥ 3). Data were analyzed using Student’s t-test; *p ≤ 0.05, **p ≤ 0.01.

