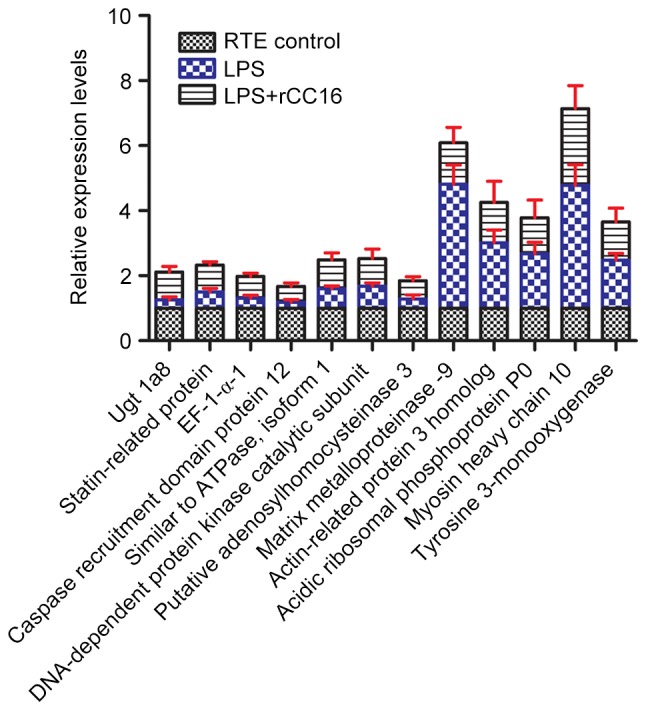
Figure 2.

Protein expression profiles of RTE cells cultured in the presence or absence of LPS and rCC16. Seven proteins were downregulated by LPS only (LPS) and upregulated by additional rCC16 treatment (LPS+rCC16), and five proteins were upregulated by LPS only (LPS) and downregulated by further rCC16 treatment (LPS+rCC16). Data are presented as fold changes (≤0.83 for downregulated proteins or ≥1.2 for upregulated proteins) averaged from three independent experiments. RTE, rat tracheal epithelial; LPS, lipopolysaccharide; rCC16, recombinant Clara cell protein. Ugt 1a8, uridine diphosphate glycosyltransferase 1 family polypeptide A8; EF-1-α-1, elongation factor 1-α 1.
