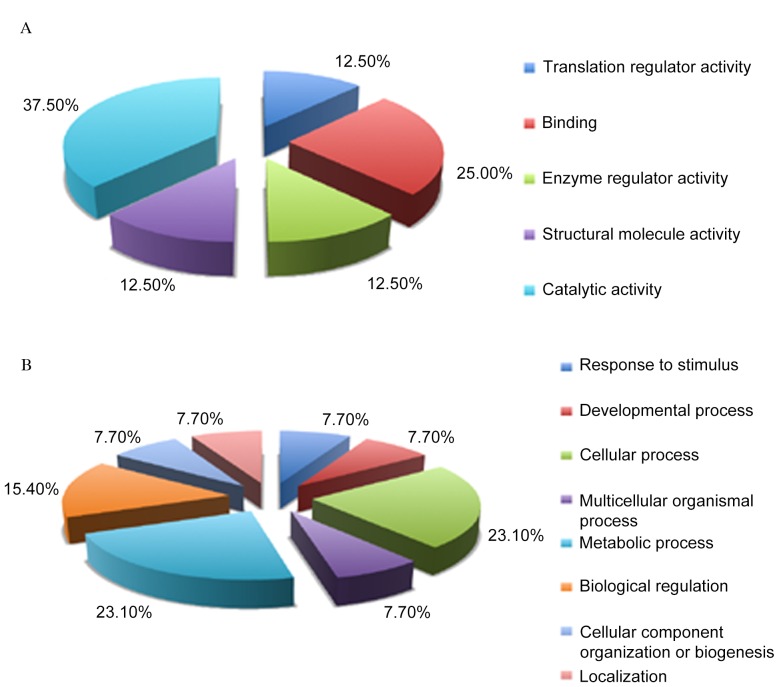
Figure 3.
Gene ontology analysis of differentially expressed proteins based on (A) their molecular functions and (B) their associated biological processes, using PANTHER classification. Over-representation statistics were performed using the hypergeometric analysis and Benjamini & Hochberg False Discovery Rate correction.

