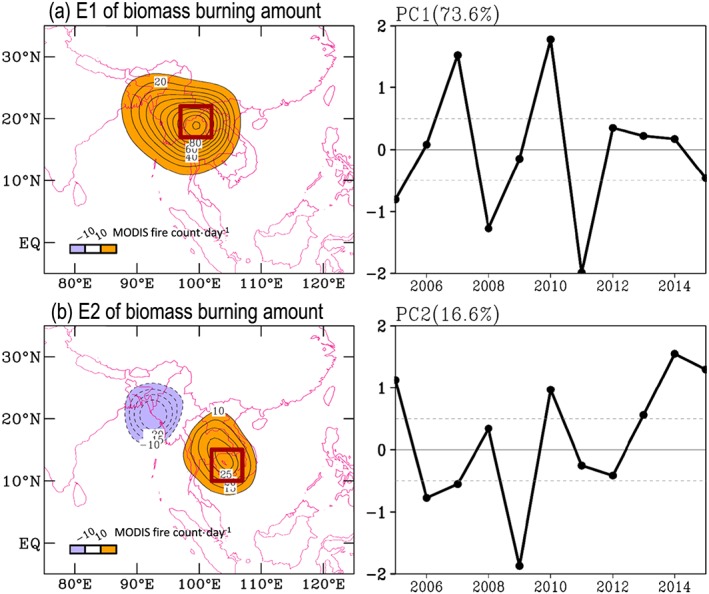
Figure 2.

(a) The first‐principle mode of the empirical orthogonal function (EOF) analysis on the anomalies of springtime (i.e., MA mean) biomass burning activities during 2005~2015. The eigenvector and eigencoefficient are given in the left and right plots, respectively. (b) Similar to Figure 2a but for the second‐principle mode. In E1 (E2), the domain of the maximum variation center in northern (southern) Indochina covering 17–22°N, 97–102°E (10–15°N, 102–107°E) is marked.
