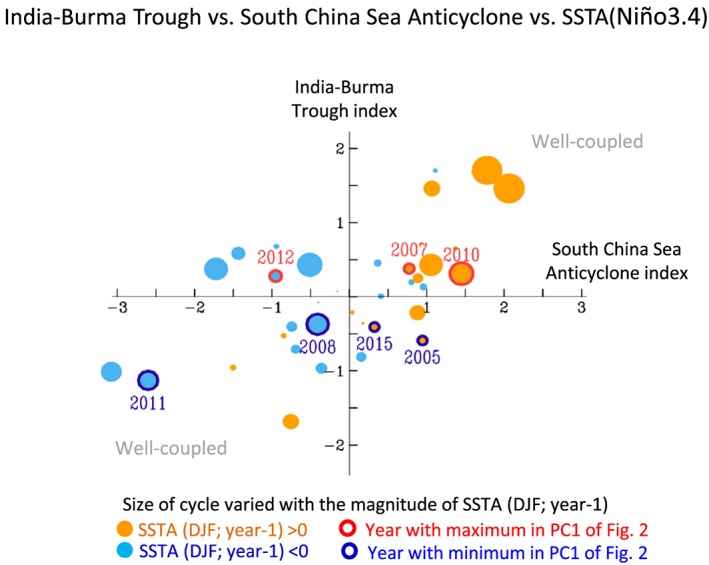
Figure 9.

Bubble plot of the springtime (March and April mean) India‐Burma Trough index (defined as the area‐averaged 700 hPa vorticity, ζ, over 20–30°N, 85–110°E) and the corresponding South China Sea anticyclone index (defined as the “negative” 700 hPa vorticity, −ζ, area averaged over 5–15°N, 95–120°E) during 1979–2015. The explanation for examining the changes over the longer time period (1979–2015) is given in the manuscript. The orange (blue) bubbles are the positive (negative) sea surface temperature anomalies (SSTAs) over the Niño3.4 region in the previous winter, with the size of the bubbles indicating the magnitude of the SSTA. The red (blue) open circles are the years with maximum (minimum) PC1 values of Figure 2.
