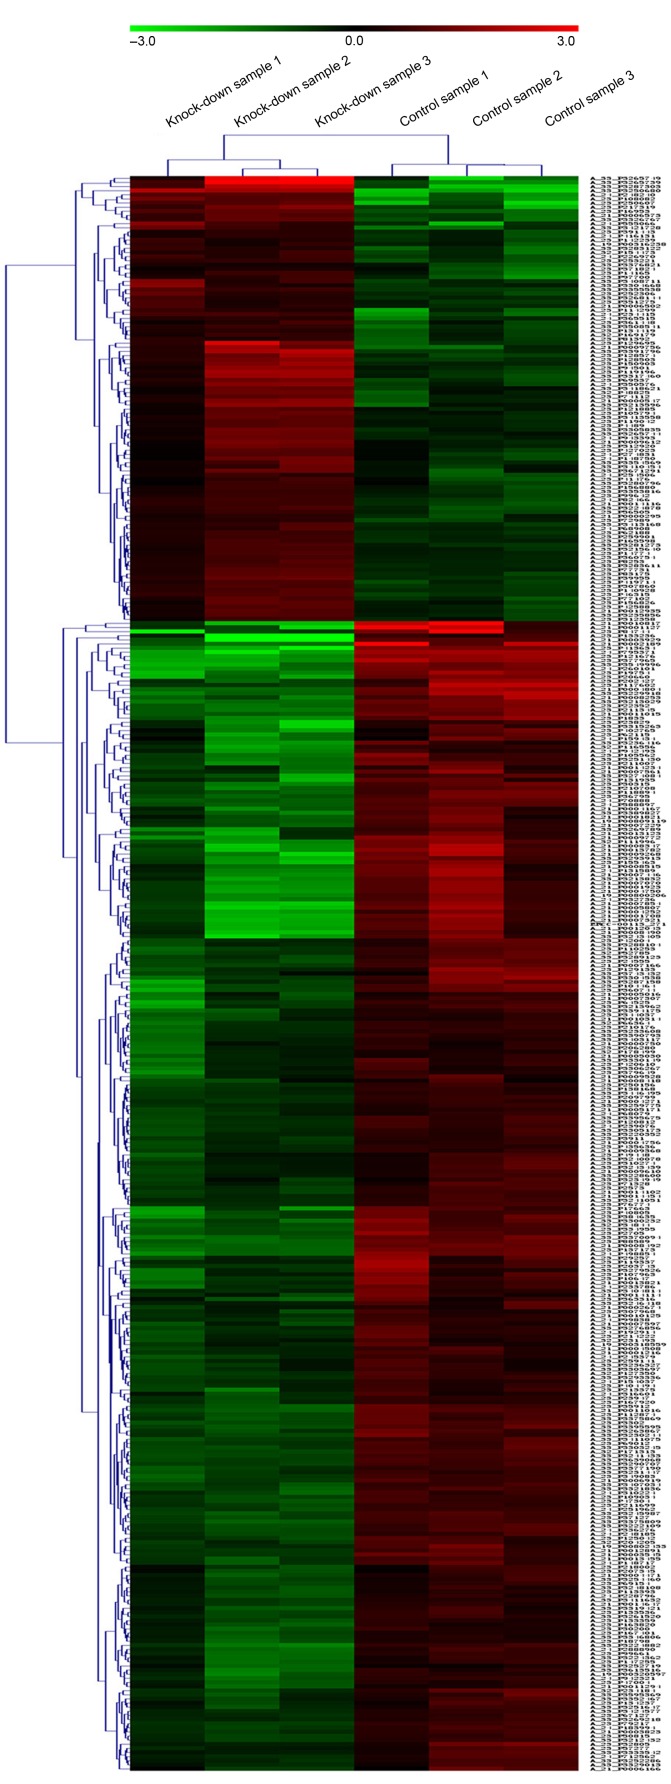
Figure 3.
Heat map of differentially expressed genes between 6 samples. Each row represents a probe and each column represents a sample. The color indicates the level of mRNA expression: Green, lower expression; red, higher expression; black, no expression changes. The Golli-myelin basic protein gene knock-down samples were clustered together and clearly separated from three normal samples.

