
Figure 2. vam is Epistatic to fat.
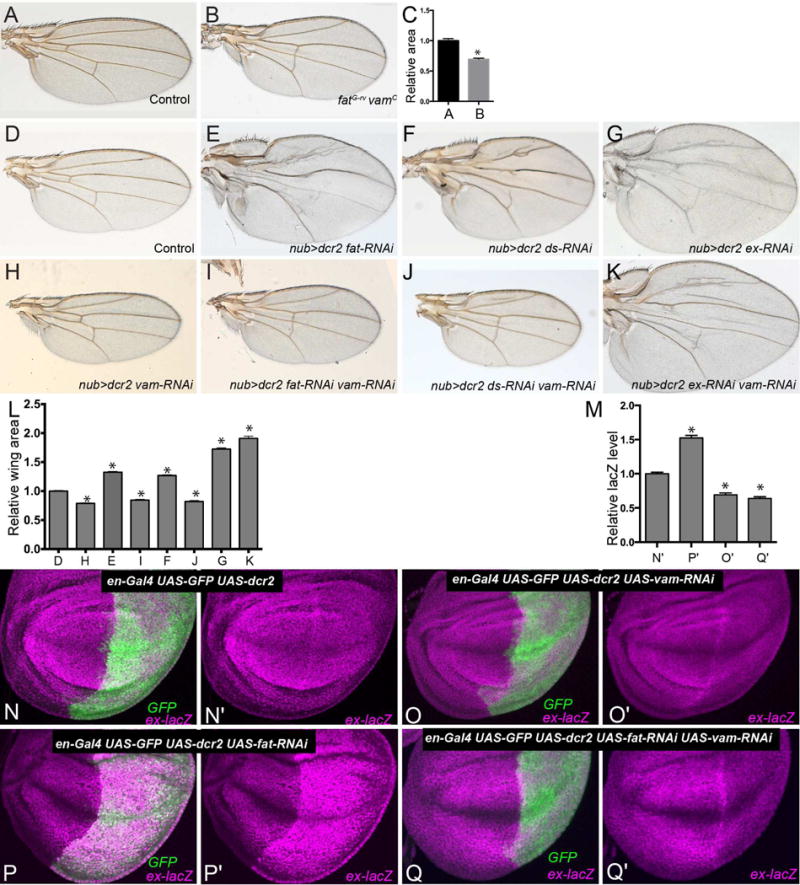
Adult male wings from w1118 control (A) and homozygous ftG-rv vamc mutant (B) flies. (C) Quantification of relative wing areas of the genotypes shown in A and B. Data are shown as mean ± SEM from measurements of 8–12 wings per genotype. *P <0.001 (Student’s t test). D–K) Adult male wings from flies expressing nub-Gal4 UAS-dcr2 (control)(D), nub-Gal4 UAS-dcr2 UAS-fat-RNAi (E), nub-Gal4 UAS-dcr2 UAS-ds-RNAi (F), nub-Gal4 UAS-dcr2 UAS-ex-RNAi (G), nub-Gal4 UAS-dcr2 UAS-vam-RNAi (H) nub-Gal4 UAS-dcr2 UAS-fat-RNAi UAS-vam-RNAi (I), nub-Gal4 UAS-dcr2 UAS-ds-RNAi UAS-vam-RNAi (J), nub-Gal4 UAS-dcr2 UAS-ex-RNAi UAS-vam-RNAi (K). L) Histogram of relative wing areas in flies of the genotypes shown in panels D–K. M) Histogram of ratio of lacZ levels in the posterior compartments relative to the anterior compartments, in third instar wing imaginal discs from flies of the genotypes shown in panels N–Q, normalized to the mean ratio from control flies. (N–Q) Third instar wing imaginal discs expressing en-Gal4 UAS-dcr2 UAS-GFP ex-lacZ (N, N′) and UAS-fat-RNAi (P, P′) UAS-vam-RNAi (O,O′) UAS-fat-RNAi and UAS-vam-RNAi (Q, Q′), stained for expression of ex-lacZ (magenta), with posterior cells marked by expression of GFP (green). Data are shown as mean ± SEM from measurements of 10–12 wings/wing discs per genotype, error bars indicate SEM. *P<0.001 (Student’s t test between control and the other genotypes). See also Fig. S2.