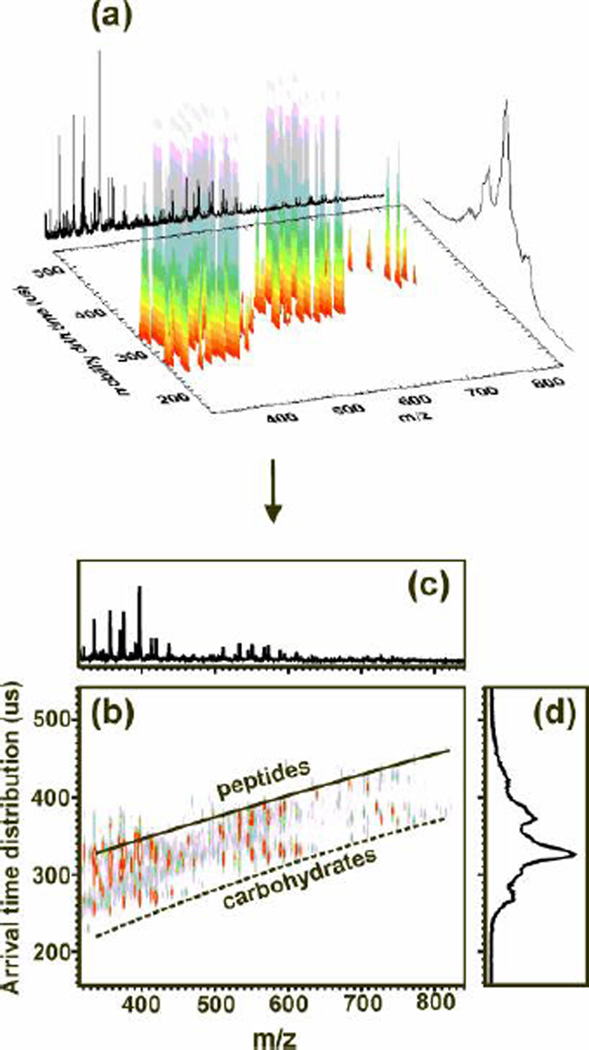
Figure 2.
(a) A 3D representation of IM-MS data obtained for human glycoprotein (HGP) digested with Pronase. (b) A 2D IM-MS conformation space plot for the analysis of the HGP digest. This data illustrates the variation of gas-phase packing efficiencies for different types of biomolecules. Even though the glycans may still have amino acids attached, a clear differentiation between the peptides and glycans can be noted. (c) An integrated mass spectrum over all arrival time distributions. (d) The integrated arrival time distribution over the full mass range which would be obtained if a detector was placed after the IM drift cell.

